GRAFANA - Analytical and visualization software for IPLOG PLC
Update in progress
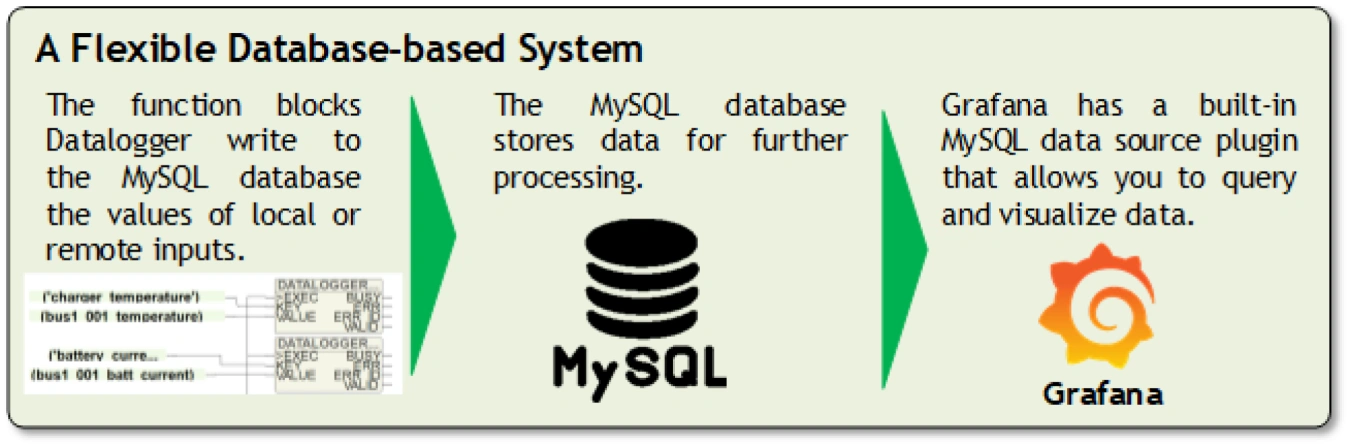
The world is changing rapidly and needs flexible solutions that respond to customer requirements. IPLOG, with its online application repository, is just such a solution. Customers can easily extend the basic toolbox with additional freeware applications available in this online repository. A typical example is the analytical software Grafana. It allows the user to visualize the data stored in the database in customized dashboards with graphs, tables and automatic alerts. The system architecture is very simple and scalable. It allows deployment in small systems with only one IPLOG working independently of the Internet, but also in larger systems with IPLOGs installed in different geographical locations.
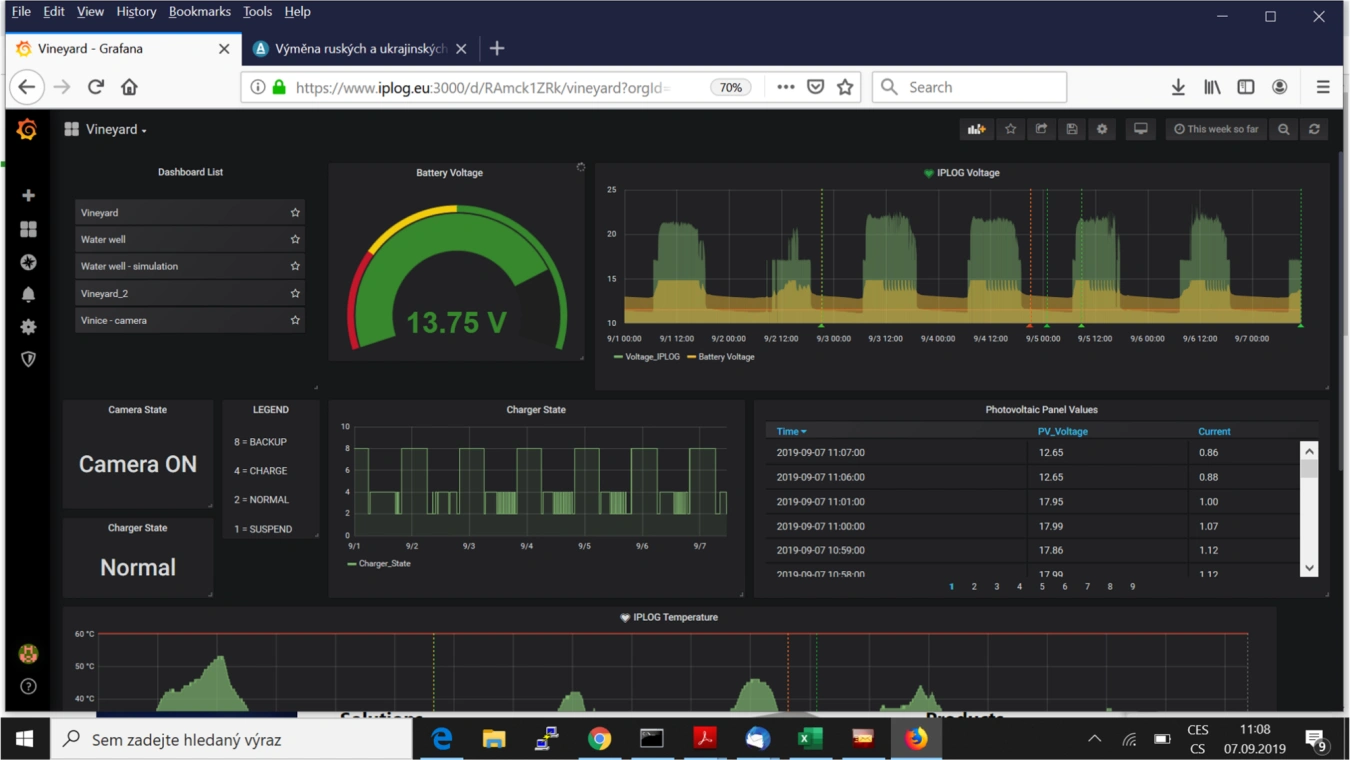
A plethora of visualisation options
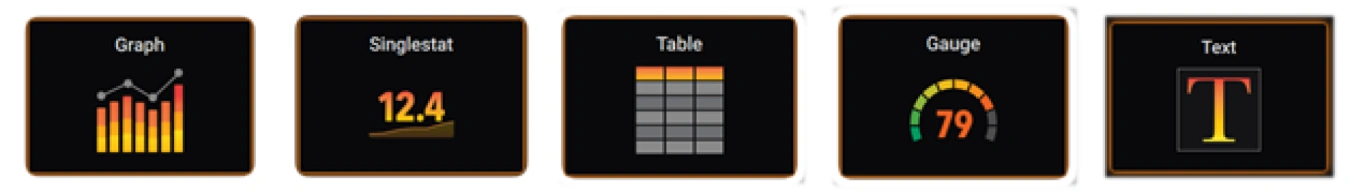
There are many options to choose from in the configuration menu.
Supported by popular web browsers
Data is displayed directly in popular browsers Chrome/Chromium, Firefox, Safari and Microsoft Edge, making it easy to use Grafana on mobile phones, tablets and computers.

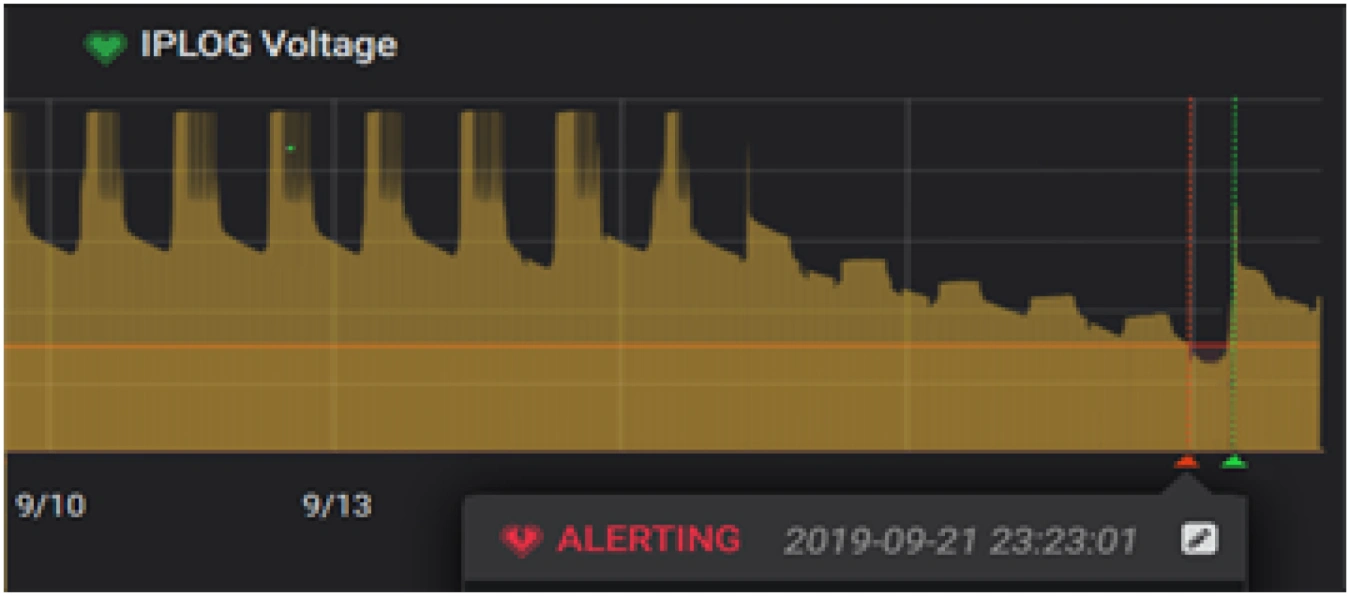
Support for sending alerts
In addition to visualizing current and historical values, Grafana can automatically send email alerts informing users that critical values have been reached in the system. Typical examples are monitoring operating temperature, low battery, etc.
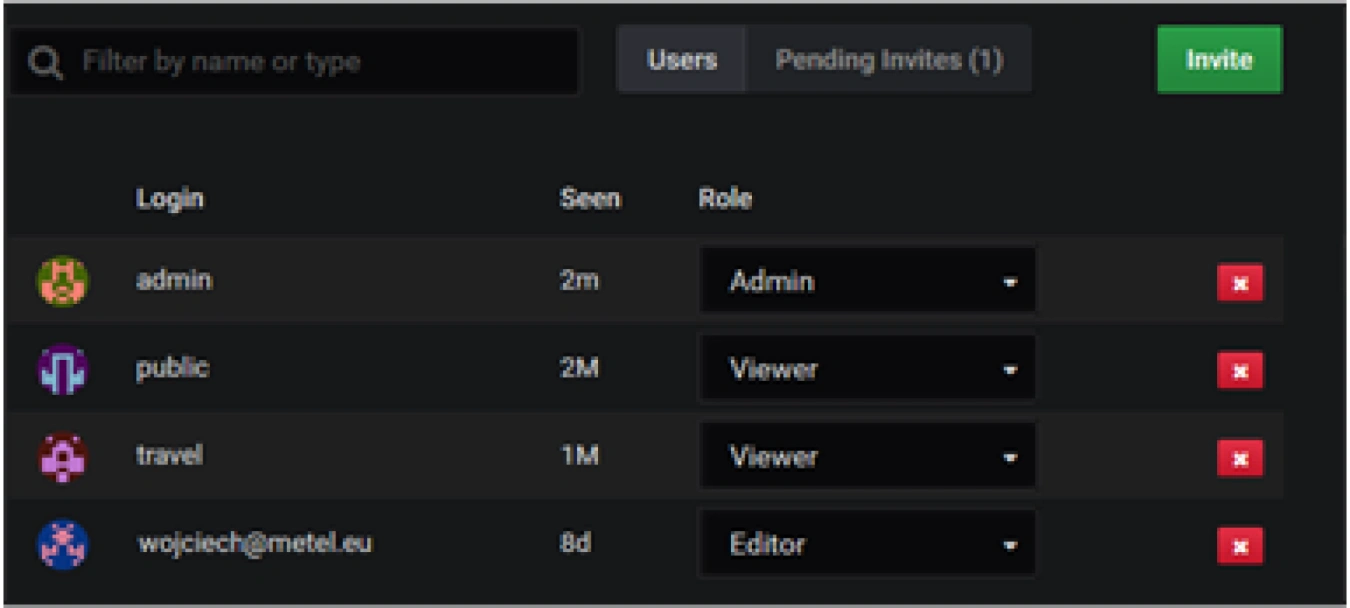
Multi-level user permissions
Users have permissions that are determined by their:
- Organizational role - administrator, editor or viewer
- Team Membership
- Permissions assigned to individual users.